Market Trends for Palo Alto - 94306
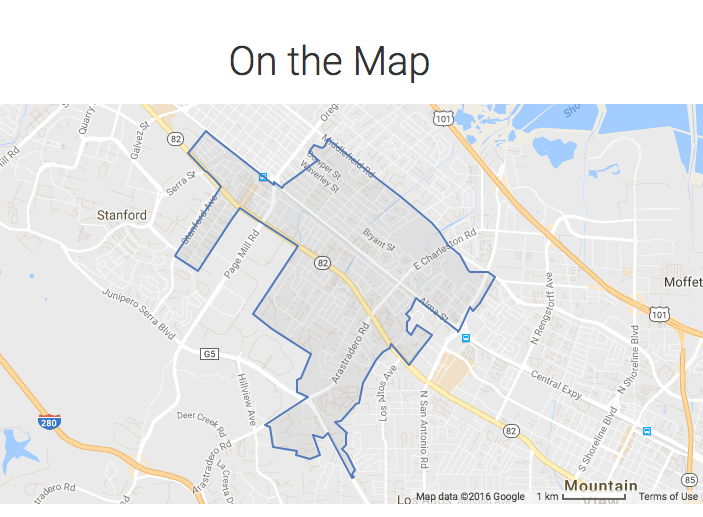
The local real estate market is changing and that means the changes will be reflected in the days on market, as well as the listing price and listing price per square foot. While the days on market is an easy overview, the true shift can be seen more clearly when looking at the listing price per square foot and then looking at the same data for each individual neighborhood. Here is a map showing 94306 boundaries.
DAYS ON MARKET | LISTING PRICE | LISTING PRICE / SQFT | ||
|---|---|---|---|---|
January - 37 | $2,198,000 | $1,240 | ||
February - 14 | $2,598,000 | $1,400 | ||
March - 14 | $2,789,000 | $1,400 | ||
April - 19 | $2,386,000 | $1,280 | ||
May - 18 | $1,986,000 | $1,220 | ||
June - 25 | $1,996,000 | $1,240 |
Interested in finding out about your specific neighborhood? Click here for a complimentary valuation.
Want to see everything for sale in Palo Alto? Click here to search all Palo Alto properties.
Christina Hood and the Silicon Valley Hoods Real Estate Team have served homeowners from Southern California to the Bay Area. Interested in finding out how the team can serve your real estate needs?


